Table of Contents
Python/FSL Resting State Pipeline
This pipeline is a collection of steps that can be used to process a single subject's resting state data from raw into a node based correlation matrix representing connectivity between different regions of the brain.
resting_pipeline.py -h
Usage:
resting_pipeline.py --func /path/to/run4.bxh --steps all --outpath /here/ -p func

Program to run through Nan-kuei Chen's resting state analysis pipeline:
    steps:
    0 - convert data to nii in LAS orientation ( we suggest LAS if you are skipping this step )
    1 - slice time correction
    2 - motion correction, then regress out motion parameter
    3 - skull stripping
    4 - normalize data
    5 - regress out WM/CSF
    6 - bandpass filter
    7 - do parcellation and produce correlation matrix from label file
      * or split it up:
         7a - do parcellation from label file
         7b - produce correlation matrix [--func option is ignored if step 7b
              is run by itself unless --dvarsthreshold is specified, and
              --corrts overrides default location for input parcellation
              results (outputpath/corrlabel_ts.txt)]
    8 - functional connectivity density mapping


Options:
  -h, --help            show this help message and exit
  -f /path/to/BXH, --func=/path/to/BXH
                        bxh ( or nifti ) file for functional run
  --throwaway=4         number of timepoints to dis-regard from beginning of
                        run
  --t1=/path/to/BXH     bxh ( or nifti ) file for the anatomical T1
  -p func, --prefix=func
                        prefix for all resulting images, defaults to name of
                        input
  -s 0,1,2,3, --steps=0,1,2,3
                        comma seperated string of steps. 'all' will run
                        everything, default is all
  -o PATH, --outpath=PATH
                        location to store output files
  --sliceorder=string   sliceorder if slicetime correction ( odd=interleaved
                        (1,3,5,2,4,6), up=ascending, down=descending,
                        even=interleaved (2,4,6,1,3,5) ).  Default is to read
                        this from input BXH, if available.
  --tr=MSEC             TR of functional data in MSEC
  --ref=FILE            pointer to FLIRT reference image if not using standard
                        brain
  --flirtmat=FILE       a pre-defined flirt matrix to apply to your functional
                        data. (ie: func2standard.mat)
  --refwm=FILE          pointer to WM mask of reference image if not using
                        standard brain
  --refcsf=FILE         pointer to CSF mask of reference image if not using
                        standard brain
  --refgm=FILE          pointer to GM mask of reference image if not using
                        standard brain
  --refbrainmask=FILE   pointer to brain mask of reference image if not using
                        standard brain
  --refacpoint=45,63,36
                        AC point of reference image if not using standard MNI
                        brain
  --betfval=0.4         f value to use while skull stripping. default is 0.4
  --anatbetfval=0.5     f value to use while skull stripping ANAT. default is
                        0.5
  --lpfreq=0.08         frequency cutoff for lowpass filtering in HZ.  default
                        is .08hz.  highpass is fixed at .001hz.
  --corrlabel=FILE      pointer to 3D label containing ROIs for the
                        correlation search. default is the 116 region AAL
                        label file
  --corrtext=FILE       pointer to text file containing names/indices for ROIs
                        for the correlation search. default is the 116 region
                        AAL label txt file
  --corrts=FILE         If using step 7b by itself, this is the path to
                        parcellation output (default is to use
                        OUTPATH/corrlabel_ts.txt), which will be used as input
                        to the correlation.
  --dvarsthreshold=THRESH
                        If specified, this reprsents a DVARS threshold either
                        in BOLD units, or if ending in a '%' character, as a
                        percentage of mean global signal intensity (over the
                        brain mask).  Any volume contributing to a DVARS value
                        greater than this threshold will be excluded
                        ("scrubbed") from the (final) correlation step.  DVARS
                        calculation is performed on the results of the last
                        pre-processing step, and is calculated as described by
                        Power, J.D., et al., "Spurious but systematic
                        correlations in functional connectivity MRI networks
                        arise from subject motion", NeuroImage(2011).  Note:
                        data is only excluded during the final correlation,
                        and so will never affect any operations that require
                        the full signal, like regression, etc.
  --dvarsnumneighbors=NUMNEIGHBORS
                        If --dvarsthreshold is specified, then
                        --dvarsnumnumneighbors specifies how many neighboring
                        volumes, before and after the initially excluded
                        volumes, should also be excluded.  Default is 0.
  --fdthreshold=THRESH  If specified, this reprsents a FD threshold in mm.
                        Any volume contributing to a FD value greater than
                        this threshold will be excluded ("scrubbed") from the
                        (final) correlation step.  FD calculation is performed
                        on the results of the last pre-processing step, and is
                        calculated as described by Power, J.D., et al.,
                        "Spurious but systematic correlations in functional
                        connectivity MRI networks arise from subject motion",
                        NeuroImage(2011).  Note: data is only excluded during
                        the final correlation, and so will never affect any
                        operations that require the full signal, like
                        regression, etc.
  --fdnumneighbors=NUMNEIGHBORS
                        If --fdthreshold is specified, then
                        --fdnumnumneighbors specifies how many neighboring
                        volumes, before and after the initially excluded
                        volumes, should also be excluded.  Default is 0.
  --motionthreshold=THRESH
                        If specified, any volume whose motion parameters
                        indicate a movement greater than this threshold (in
                        mm) will be excluded ("scrubbed") from the (final)
                        correlation step.  Volume-to-volume movement is
                        calculated per pair of neighboring volumes from the
                        three rotational and three translational parameters
                        generated by mcflirt.  Motion for a pair of
                        neighboring volumes is calculated as the maximum
                        displacement (due to the combined rotation and
                        translation) of any voxel on the 50mm-radius sphere
                        surrounding the center of rotation.  Note: data is
                        only excluded during the final correlation, and so
                        will never affect any operations that require the full
                        signal, like regression, etc.
  --motionnumneighbors=NUMNEIGHBORS
                        If --motionthreshold is specified, then
                        --motionnumnumneighbors specifies how many neighboring
                        volumes, before and after the initially excluded
                        volumes, should also be excluded.  Default is 1.
  --motionpar=FILE.par  If --motionthreshold is specified, then --motionpar
                        specifies the .par file from which the motion
                        parameters are extracted.  If you allow this script to
                        perform motion correction, then this option is
                        ignored.
  --scrubop=SCRUBOP     If --motionthreshold, --dvarsthreshold, or
                        --fdthreshold are specified, then --scrubop specifies
                        the aggregation operator used to determine the final
                        list of excluded volumes.  Default is 'or', which
                        means a volume will be excluded if *any* of its
                        thresholds are exceeded, whereas 'and' means all the
                        thresholds must be exceeded to be excluded.
  --powerscrub          Equivalent to specifying --fdthreshold=0.5
                        --fdnumneighbors=0 --dvarsthreshold=0.5%
                        --dvarsnumneigbhors=0 --scrubop='and', to mimic the
                        method used in the Power et al. article.  Any
                        conflicting options specified before or after this
                        will override these.
  --scrubkeepminvols=NUMVOLS
                        If --motionthreshold, --dvarsthreshold, or
                        --fdthreshold are specified, then --scrubminvols
                        specifies the minimum number of volumes that should
                        pass the threshold before doing any correlation.  If
                        the minimum is not met, then the script exits with an
                        error.  Default is to have no minimum.
  --fcdmthresh=THRESH   R-value threshold to be used in functional
                        connectivity density mapping ( step8 ). Default is set
                        to 0.6. Algorithm from Tomasi et al, PNAS(2010), vol.
                        107, no. 21. Calculates the fcdm of functional data
                        from last completed step, inside a dilated gray matter
                        mask
  --cleanup             delete files from intermediate steps?
Step Descriptions
Step 0
- this step take the input bxh/nifti and changes the orientation of the data into LAS, then converts the data into niigz.
- LAS is suggested because this is the orientation of the fsl T1 template. When starting with the correct orientation we've found that there's far less of a chance of flirt messing up down the road in the normalization step
- this step utilizes the BXH tools
- if –throwaway is defined, this number of timepoints will be disregarded during this step
Step 1
- run fsl's slice time correction ( slicetimer )
- if starting with a BXH header, you'll likely have the sliceorder field which will be used to create a custom sliceorder file to be used by fsl
- the default is to run bxh_slicetiming to extract a timing file from the BXH header
- if this isn't present, then you'll need to define –sliceorder so that we can generate the file for you
- “odd” is interleaved with odd, then even slice ordering: 1,3,5,2,4,6,etc
- “even” is also interleaved, but when even slice ordering: 2,4,6,1,3,5,etc … Siemen's data sometimes comes this way when selecting interleaved with an even number of slices
- “up” is ascending data, from the bottom up: 1,2,3,4,5,6
- “down” is descending data, from the top down: 6,5,4,3,2,1
- this gets much more complicated with multi-band data, so using the default extraction is recommended
Step 2
- motion correct data using fsl's mcflirt
- once mcflirt is completed, the 6 motion parameters ( which will be in a .par file ) are then regressed out of each individual voxel usings a linear regression
Step 3
- the functional run is meaned across time with fslmaths, then bet is applied. the resulting mask is then applied to the entire run of data
- if you find that bet is doing a poor job finding the edges you can adjust the intensity threshold with –betfval
- this is equivalent of -f when actually running bet. the default is 0.4 (same as feat), but smaller values will be more conservative in finding the edges of the brain ( ie: larger mask )
- if provided T1 anatomical is skull stripped. –anatbetfval is used to control intensity threshold, the default is 0.5 (same as feat)
Step 4
- normalize the data using flirt
- if no options are specified, then the default is the standard MNI152_T1_2mm_brain used in feat
- if you have a specific template, you can define it with –ref (ie: a kid brain, or study specific template)
- if your subject has already been normalized during standard pre-processing of other runs, please provide the flirt matrix from pre-stats with –flirtmat ( most likely example_func2standard.mat)
- this will apply the previously determined flirt matrix to your functional data instead of trying to calculate a new matrix based on the functionals. the matrix from pre-stats was likely calculated using a high-resolution anatomical, also this will assure that your resting state runs are in the same space as the other runs from your subject.
- if you've provided at T1 anatomical image then this sequence is followed:
- func-2-t1
- t1-2-standard
- flirt matrices are concatenated to create func-2-standard
- if no T1 is provided, then the functional is used for the flirt normalization
Step 5
- this step will take the white matter and csf masks generated by FAST and regress out the signal from the functional data using the same method as the motion paramters.
- if you've provided your own reference image for normalization, then you need to provide a white-matter and csf mask ( –refwm –refcsf )
- this can be create with “fast -g INPUT.nii.gz”: pve_2 is the white matter, pve_0 is csf
- if no options are defined, then the MNI152 masks will be used
Step 6
- this step will band-pass filter data to remove high-frequency noise using custom python code
- the default lowpass is 0.08 HZ
- highpass is fixed at .001 HZ
- if you'd like to chose a different frequency, please use –lpfreq
Step 7
- if defaults are used, then the aal_MNI_V4 label file is used to extract the average timeseries for each of the 116 regions
- if –dvarsthreshold or –motionthreshold are specified, then the ROI-averaged timeseries are further filtered (“scrubbed”) by removing timepoints that exceed the given thresholds
- cross correlation coefficients are found for the entire matrix of 116×116 regions
- this step produces 4 files:
- “subject.graphml” : graphml format with regions timecourse, zr_vals, r_vals
- “corrlabel_ts.txt”: extracted time series for each region
- “r_matrix.nii.gz”: the correlation coefficients
- “zr_matrix.nii.gz”: normalized correlation coefficients
- “mask_matrix.nii.gz”: an inclusion mask for everything below the intersect of the regions, which can be used at a higher level
- since they are saved as nifti, then can be loaded into fslview.
- if the default labels are used, then you can load a custom atlas ( “AAL116 Correlation Atlas” ) into fslview which will allow you to see which regions each “voxel” represents
- this is loaded through the Atlas Toolbar, the atlas is installed on the cluster, but it can be provided with instructions to install elsewhere.
- if you want to provide your own label file, the –corrlabel option can be used.
- The input to this step would be a 3D image of ROIs the same size as your normalized data.
- Each individual ROI needs to have a unique intensity value for the timecourse extraction ( ie: 5 ROIs with intergers as values from 1-5 ).
- This would be the standard type of thing saved from the pickatlas
- Also provide a label text –corrtext file with your labels intensity value and label name in tab delimited format
- If your space is different from mni please provide the anterior commissure point –refacpoint for centroid/XYZ conversion
- The correlation matrix would then be NumRois X NumRois and point 1,4 would be the corrcoef or zscore of the ROI with values 2 and 5 ( these are indexed starting at zero )

* that is the zr_values from the subject.graphml displayed in matplotlib. the cursor shows the intersecting region at the bottom, and if you click, time courses are displayed. we're working on a release (cp - 3/30/12)
For the rs-pipeline viewer:
/usr/local/packages/biacpython/bin/rspipe_viewer.py --help
Usage:
rspipe_viewer.py --graphml /path/to/subject.graphml --stat zrvalue

Program to display graphml output from resting_pipeline
 --stat is the statistic to view ( zrvalue, rvalue )
 --notimecourse is a flag to skip the timecourse display when clicking


Options:
  -h, --help            show this help message and exit
  -g /path/to/subject.graphml, --graphml=/path/to/subject.graphml
                        full path to graphml file to display
  -s zrvalue, --stat=zrvalue
                        statistic type to display ( zrvalue or rvalue ).
                        default zr
  --notimecourse        do not display the seperate timecourse figures
Step 8
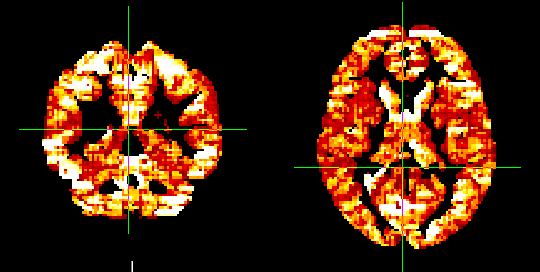
- Functional connectivity density mapping
- Takes functional data from last step and calculates how connected they are to the voxels around them
- uses ( –fcdmthresh and –refgm ) as the pearson r-value and gray matter mask
- if defaults are used, then a dilated gray matter mask is used from FAST segmentation of MNI brain and a pearson r value of 0.6
- Iteratively goes to all neighboring voxels and counts the number that have correlated signal until they are under the r threshold
- adapted from Dardo Tomasi, PNAS(2010), vol. 107, no. 21. 9885–9890
- resulting file with be “fcdm.nii.gz”; higher voxel values indicate more correlation from neighbors
Things to consider
- this was designed to be modular, so that you only need to run the steps you need
- if you've already pre-processed your data, then you may only need steps 5,6,7 … please provide the –steps flag as needed.
- the default is “all”
- If you just want to run a different label file, then you may only need step 7
- If you have physiological data, it should be removed from the functional data prior to running the pipeline
- this is installed on the cluster, but can also be run on a personal linux machine, or mac
- nonstandard python dependencies: numpy, nibabel
- FSL
- bxh/xcede tools for step0
Group Analysis Suggestions
One method group analysis could be done using Monte-Carlo permutation testing with FSL's randomise .
- please don't add any clustering/smoothing/etc … that would not make any sense in this context since 1 individual voxel represents one connection, you would not want to smooth across any of those
To do this, you would combine all of your subjects's results into one 3D file with fslmerge ( 116 x 116 x NumSubjs ):
>> fslmerge -t group_zr subj1/zr_matrix.nii.gz subj2/zr_matrix.nii.gz subj3/zr_matrix.nii.gz subjN/zr_matrix.nii.gz
For a single group result, the input to randomise is simply:
>> randomise -i group_zr -o group_res -1 -x -m mask_matrix

  * -i input, -o output prefix, -1 represents a 1-tailed t-test, -x will output corrected ( _corrp_ ) and uncorrected ( _p_ ) pvals,
  * -m points to one of the inclusion masks produced for your matrix ( this assures the connections aren't being used twice )
Your results will be the same correlation matrix size, but now will represent corrected p-values of the connectivity.
To do something more complicated ( group differences, other regressions ), please create a design matrix and contrasts file using FSL's Glm gui.
- this will look identical to creating a 3rd-level design matrix through the feat gui.
- the same same types of things done through feat can be done here … Feat Higher Level GLMs
- Below is a snapshot of a simple 2-group model designed with the Glm wizard.

Now, within randomise you need to input the .mat and .con files instead of “-1” to produce your contrasts.
>> randomise -i group_zr -o group_res -d 2group.mat -t 2group.con -x -m mask_matrix
The results will be in the same format described above, except there will be more contrasts labeled as “tstat#”
- tstat1 represent contrast 1 as defined in your GLM, tstat2 contrast 2, etc
If using the cluster, you can turn on “fsl_sub” with export FSLSUBMIT=1, then use randomise_parallel, which will run all the permutations simultaneously.
Here's an example of the matrix with the matrix_mask, including this would only analyze things inside the yellow triangle:

Going Further
connectome2graphml.py --help
Usage:
connectome2graphml.py -s stats.nii.gz -p prefix

Program to convert the 2D correlation matrix to a graphml file which can be used with graph-theory packages.
    --type is the statistics type ( ie: pvalue, rvalue, zrvalue )
    --labels and --text default to aal116 if no input is provided ( ie: aal116, raichle36 or full paths )
    --AC point defaults to 45,63,36 if undefined ( assuming MNI152_T1_2mm_brain )
    --thresh is the threshold to use for extracting edges. default is 0. ( ie: .99 for p > .01 )
    --above is to specify that your stats are above the diagonal instead of below ( below is the default )


Options:
  -h, --help            show this help message and exit
  -s FILE, --stats=FILE
                        input correlation matrix
  --type=STRING         type of statistics of input matrix
  --thresh=STRING       threshold for edge extraction
  -l FILE, --labels=FILE
                        label file used to produce the correlation matrix
  -t FILE, --text=FILE  delimited text file associated with correlation labels
                        ( contains region index and names )
  --ac=STRING           anterior commissure point for coordinate conversion
  -p STRING, --prefix=STRING
                        prefix to name your output graphml
  --above               option to specify if your stats are above the diagonal of the connectome instead of below
                           ( below is the default )
- Convert the 3rd-Level connectome results into a graphml ( xml based definition for graphs ) file to be used with graph-theory based analyses/graphing methods
- We have written some code to perform some simple graphing methods using Networkx
- The following functions will be based on the graphml created with the connectome2graphml.py function
2D Graph-Theory Representation
connectome_2Dgraph.py --help
Usage:
connectome_2Dgraph.py --graphml /path/to/connectome.graphml --edgeval pvalue --thresh 0.9998

Generates a graphy-theroy 2D graph with nodes/edges above a certain threshold.
    Communities are colored by a Louvian algorithm.
    Clicking a specific node with produce another graph containing only nodes that are directly connected to the area selected.
    EDGEVAL is the label for the statistic from the .graphml file created above

Options:
  -h, --help            show this help message and exit
  -g /path/to/graphml, --graphml=/path/to/graphml
                        graphml file containing connectome information
  -t 0.9998, --thresh=0.9998
                        threshold to use for displaying significant connection
  -e pvalue, --edgeval=pvalue
                        the statistic that is represented by the connections
                        in the graphml
- This function takes your graphml input:
- thresholds out the “edges” ( connections between regions )
- calculates their “community” based on a Louvian detectuin algorithm ( http://perso.crans.org/aynaud/communities/ )
- plots the graph in 2D brain space ( the z-dimension is thrown out )
- Node ( ROI ) color represent community, Node size represents “degree” ( how many edges are connected to each node )
- If you click a node of interest, a new ego_graph will be shown ( all nodes with a direct connection to your ROI )
connectome_2Dgraph.py -g myconnectome_all.graphml --thresh 0.99 -e pvalue


3D VTK:

Download Source
- source files assume you have a working install of FSL and all imported python modules
- need a working install of the BIRN BXH/Xcede tools
- will need to edit any paths that may be different at your install location ( FSL FAST segmentations of the MNI brain and base sets of ROIs )
- Chou et al. AJNAR(2012), May; 33(5): 833–838
- fcdm algorithm adapted from Dardo Tomasi, PNAS(2010), vol. 107, no. 21. 9885–9890