Table of Contents
Showsrs2 Quick Start Guide
by Charles Michelich
Introduction to Showsrs2
Showsrs2 allows viewing fMRI data in many forms. Data are displayed as a single base image, usually an anatomical or functional image, and any number of overlay images, usually statistical activation maps. The base and overlay images may be either 3D or 4D image sets. For example,showsrs2 can display several statistical comparisons (e.g., conditions 1, 2, and 3 of an experiment) or a four dimensional activation map on a single anatomical image; or, it could display an 3D statistical map on a time series of data.
The power of showsrs2 comes from its abilities to display multiple overlays and to adjust their transparencies, as well as its ability to plot data values. Thus, you can look underneath a statistical map to see another overlay or the anatomical data. In addition, you can click on a point in the brain to see the three orthogonal views of the brain at that point, while viewing the change in activation over time there.
Syntax for Showsrs2
The basic syntax for opening a showsrs2
''showsrs2(baseSrs,baseCfg,overlaySrs,overlayCfg,...);''
where baseSrs is your base image and each overlaySrs is an overlay image. The baseCfg and overlayCfg allow you to set the initial values for the colormaps, and clipping limits on the image. To use the default values, include a pair of brackets: [ ]. Additionally, the baseCfg specifies the voxel size and orientation of the image to be displayed. If these are specified, you can reorient the images from within the viewer. You can read about the format of the these variables (baseCfg and overlayCfg) using the command:
''help showsrs2''
Displaying an anatomical image in showsrs2
The following example will read a single image and then display it in showsrs2. Note that, as for all MATLAB variables, the examples shown here are case-sensitive.
  baseSrs=readmr('T:\BIAC\Class.01\Examples\Anatomical_Images\3D_SPGR_Full_Brain\3D_SPGR_a.img',256,256, 86,'volume');
  baseCfg.voxelSize=[0.9375,0.9375,1.5];
  baseCfg.slicePlane='Axial';
  showsrs2(baseSrs,baseCfg);
Displaying overlays in showsrs2
The following example will read a single image and an overlay and then display it in showsrs2. In this example, the anatomical image is in the stereotaxic space created by the Montreal Neurological Institute (MNI). The overlay data are taken from a recent study in which subjects had to detect infrequent “oddball” targets.
  baseSrs=readmr('T:\BIAC\Class.01\Examples\Anatomical_Images\MNI_space_brain\mni_space_brain_b.img',79,95,68,'volume');
  overlaySrs=readmr('T:\BIAC\Class.01\Examples\Statistical_maps\oddball_mni2.t',79,95,68,'float');
  baseCfg.voxelSize=[2,2,2];
  baseCfg.slicePlane='Axial';
  overlayCfg.cmapLim = [1.27,2];
  showsrs2(baseSrs,baseCfg,overlaySrs,overlayCfg,-overlaySrs,overlayCfg);
Possible Incompatibility Notes
Showsrs2 uses the OpenGL framework for graphic display. On some computers, there may be incompatibilities with the installed OpenGL drivers. This may result in error messages in MATLAB. To use the MATLAB software driver type the following line (performance may suffer slightly):
''feature('UseGenericOpenGL',1);''
Basic Controls for showsrs2
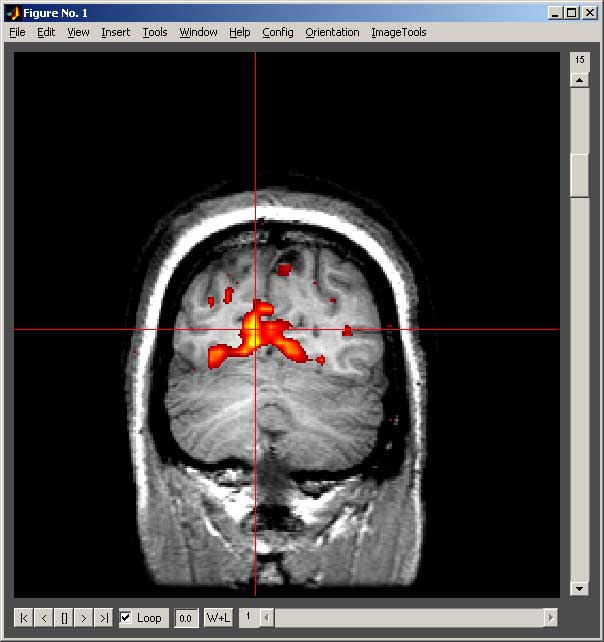
Controls for showsrs2 Main Window
- The slider at the left of the window changes slices.
- The slider at the bottom of the screen changes volumes.
- The buttons at the bottom left of the screen work like controls on a VCR: |< go to first volume, < play backward, [] pause, > play forward, >| go to last volume. The loop checkbox indicates whether to loop around to the front or back when you reach an end of a series. The adjacent box (begins with 0.0) is the time between successive images (play rate); increase this number to slow down the play speed. The play controls will only be functional for 4D data.
- The W+L button opens a Configure Window that controls the contrast and thresholding of each of the images. Additionally it allows one to control the transparency of all of the overlays together.
- If you click anywhere on the image, the data or time series of data for the voxel you clicked on will be shows for the base and all overlays. You can also use the keys “A” and “D” to move left and right, “W” and “S” to move up and down, and “Q” and “E” to change slices. Each press of a key changes your position by one voxel.
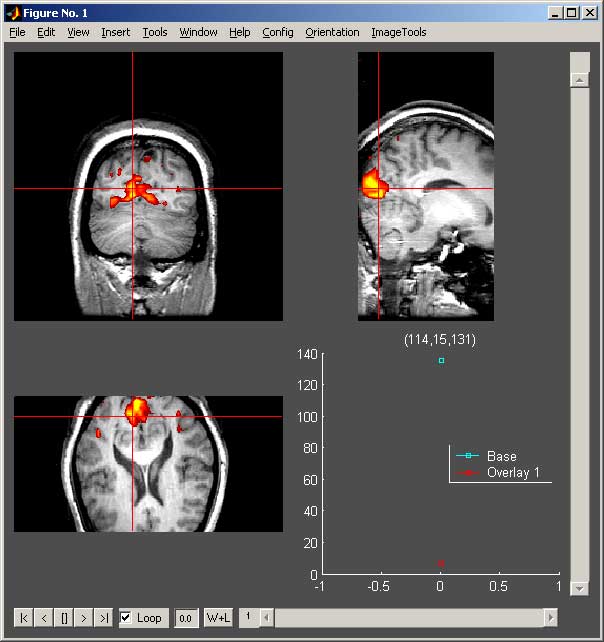
The showsrs2 figure has three important menus. The “Config” menu allows you to open new windows with additional controls and show or hide the crosshairs, legend on the time series plot, and standard figure menus. The “Adjust Colormaps and Clipping” menu item opens a Configure Window that controls the contrast and thresholding of each of the images. Additionally it allows one to control the transparency of all of the overlays together. The “Adjust Transparency” menu item opens a Transparency Window that allows you to adjust the transparency of each overlay separately. The “ImageTools” menu allows you to save the current image as a JPEG or TIFF image for use in other programs such as PowerPoint. The “Orientation” menu is only available if you have specified the voxel size and slice plane in the base configuration. This menu allows you to view the image from the axial, coronal or sagittal views. Additionally, the 3 orthogonal planes item allows you to view all three planes together. When viewing in the orthogonal plane, you can click in any view to update the slice shown in the other two views.
Controls for showsrs2 Configure Window
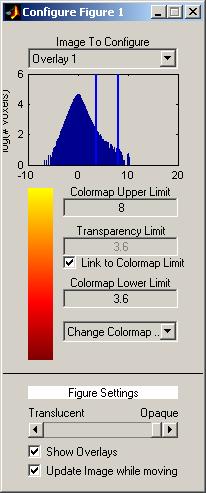
The configure window is divided into two basic sections. The top section applied to one image at a time and the bottom section applies to all images. Note that the figure is titled “Configure Figure #” where # is the figure number of the showsrs2 window being controlled.
In the top section, a drop down menu controls which image is being configured. Below this is a histogram of the image intensities where count is plotted on a log scale. The two yellow bars control the upper and lower limits of the mapping of the voxel intensities onto the colormap. You can set the colormap upper and lower limits by typing new values in their respective boxes. This distance between the upper and lower limits control the “window” (i.e., how large of an intensity difference is set between the beginning and end of the colormap) and the setting of the lower limit control the “level”. You can control the “level” (i.e., what value corresponds to the lowest colormap color). You can also control change these values by dragging the yellow line on the histogram. If your current image is an overlay, you can also control the transparency limit. Any pixels below the transparency limit are not shown on the display. By default, the colormap lower limit and the transparency limit are the same. If you want to change them independently, uncheck the “Link to Colormap limit” checkbox. The bar on the right side of the screen is the colormap for the current image. You can change it using the drop down menu labeled “Change Colormap”.
The items on the bottom section of the screen contain setting which apply to all images. The scroll bar on the bottom allows you to change the opacity of the overlays. If you move the bar to the left, the overlays become more transparent and you can see the anatomy through the images. If you right-click on the bar the Transparency Window will open allowing additional adjustments. The “Show Overlays” checkbox allows you to quickly show or hide the overlays. When the Transparency Window is open or the transparencies the overlays are not all the same the bar and checkbox will be disabled. Push the “Set all limits equal” button in the Transparency Window and close it enable the transparency controls in the Configure Menu. Finally, the checkbox “Update Image while moving” effects the behavior of the colormap limit bars in the histogram. If this is checked, the images are updated while you are moving the bars. If it is not checked, then the images are only updated when you release the mouse button. You only need to disable this feature if your computer is not fast enough to keep up with the image display.
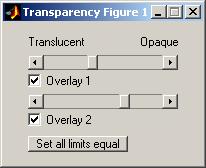
Controls for showsrs2 Transparency Window
The transparency window allows you to change the opacity of each overlay separately. Each overlay has a slider and checkbox labeled with the same label as the used in the Configure Window. If you move the slider bar to the left, the respective overlay becomes more transparent and you see the anatomy and any other overlays beneath the adjusted overlay. Each checkbox allows you to quickly show or hide the respective overlay. The button “Set all limits equal” sets the transparency of each of the limits to the same value.


